Nosokinetics
February 2006
HSCMG Adelaide 2006: Heading for success
We have had an excellent response to our call for papers for the Adelaide meeting. We have a full programme with forty or more papers and plenary talks giving a broad brush overview of the current status of modeling health and social care systems:

Outlier bed crises plague modern hospitals. Our interactive workshop considers the changing fortunes during twelve years of a New Zealand acute general medical service:
* Implementing change to solve a bed crisis;
* Living with change and the consequence of change.
Electronic Medical Records: Kaiser Permanente's Experience
Scott JT, Rundall TG, et al (2005), BMJ 331, 1313-1316:After a decision had been made to stop implementing one system and introduce another, four primary health teams in four clinics, and four specialty departments in hospitals were interviewed. Seven lessons were learnt:
1. Users perceived decision to implement was flawed;
2. Software design problems increased resistance;
3. Doctor's productivity decreased, especially initially;
4. Roles and responsibilities needed to be clarified;
5. A co-operative culture created trade offs;
6. Consensus building important;
7. Implementation fostered conflict, which resolved when the initial system was with drawn.
Editor's comment: Conflict Theory applies. When a team is faced with task difficulty there is conflict, until a leader emerges. Also the First Aphorism of Hippocrates 300 BC is apposite: 'Life is short, the art long. The occasion fleeting and judgement difficult. The physician must not only do what is right himself, but also ensure that the patient, attendants and externals co-operate with him in treatment'.
Nosological Case View
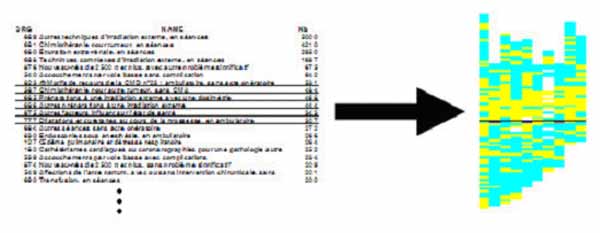
In the December 2005 issue we reported an exciting new way to describe inpatient workload. With kind permission of Pierre Levy we have been able to show the new method. The team developing Nosological Case Views is from the Hospital Hôpital Tenon and INSERM U707, Paris, France. The figures and words come from their website.In a Case View, a pixel represents a single DRG*. All the individual DRGs which form the 'pixels' come together to form an image which is the Case View.
*DRG. Diagnosis Related Group. Introduced in the 1980s in the USA to save money by defining the cost of each diagnosis. Now being adopted world wide as the 'bean counters' seek to control. It worked in USA, where they have a cost per case culture, in private and public hospitals but not here.
Case View translates a large pool of data and information into an easy-to-read graph. The visualization process offered by Case View displays the cells or 'pixels' corresponding to the individual DRG data and interprets the information according to a defined color scale for easy reference.
The process is data to case view, case view to blue print and blue print to result.
The illustration below shows how the case view chart is structured.
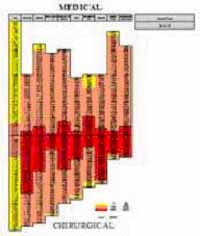
Medical activity is in the (upper section) and Surgical activity in the (lower section.)
Nosological activity: at least one Major Diagnosis Category is included in each column.
Economic activity: The closer the DRGs are to the horizontal line the costlier they are (and vice- versa.)
Further information from http://www.b3e.jussieu.fr/caseview/drgview/index.htm
Queue-Theory and Bed Occupancy: Discussion Continues
Background Notes from Roy Johnston: In the October issue I made the following concluding remark, in the context of a note on the recent healthcare modelling conference in Romania:'...A final comment, on the nature of the modelling problem. It is evident that we have a strong stochastic component in the arrivals, and a variety of service time distributions. The servicing of a patient with a given condition is likely to involve a complex set of services, for each of which there can exist a queue. The challenge to modellers is how to adapt the existing extensive and excellent body of queue-theory to describe meaningfully this complex situation, and to lead management to an understanding of the extent to which they need to supply surplus capacity in critical service areas, given that in a stochastic environment, 100% service utilisation implies infinite queues.'
Editor's Notes:
Correspondence re '100% service utilisation implies infinite queues':
Philip Dawson, a Sussex GP, sent me this:
Peter
I quite agree that 100% occupancy leads to infinite queues. Technically correct well done 10 out of 10. There are however two flaws to the argument in real terms. If there is any change to the system and it only has 99.9999999999% occupancy the queue disappears! This is where the formula does not support the model of NHS efficiency. Certainly it does not reflect the bed states data. It seems rare that we find the beds in retrospect!
The other problem is that if you have an infinite queue to get in to the service the length of time you wait becomes a matter of degree. I would quite happily wait for 10^-6 seconds but I would be annoyed if I had to wait 10^+10 seconds. That would take me back to the original Christmas! I do have to apologise to my patients that I sometimes keep them waiting for up to 10^3 seconds [about 17 mins]! The surgery does have 100% occupancy and most people are happy with that.
There are problems of queuing on the telephone to get through in the morning for an appointment. It certainly does seem infinite but in fact that is not a queuing system. When you enter the system you are told if the phone is engaged or not. The BT system does not give you the option of waiting!
Any way, Thanks for making my work in the NHS more interesting!
Kind regards / Philip Dawson
To which I replied:
Dear Philip,
Great to hear from you. May I use your letter in the next issue?
I am not sure, but I think, mathematically the queue is the rejection rate. The mathematical solution comes from the use of differential equations,. If that is not untrue, at 99.99999 occupancy the queue is not infinite..
Depending on service time (a mystical thing which in GP surgeries is based on average duration of consultation, but in constantly moving systems is much more difficult to calculate) rejections begin in computer at 65% occupancy. . In the GP surgery it would apply if every GP saw patients as they arrive i.e. each GP is a server unit and each is available to see patients as they arrive. Once you constrain it to individual GP's seeing their lists of patients the process becomes more complicated.
You made my day. I send NKNews into the ether - your reply encourages me - till we meet again
Yours / Peter
Clinical relevance
Clinically, general medicine has an unconstrained bed stock, whereas, geriatric medicine is constrained. Figure 1 comes from Anne Connolly's 2000 BSc project with Sally McClean. Her work shows in a simple model the crucial relationship between referral and rejection with a constrained bed stock.
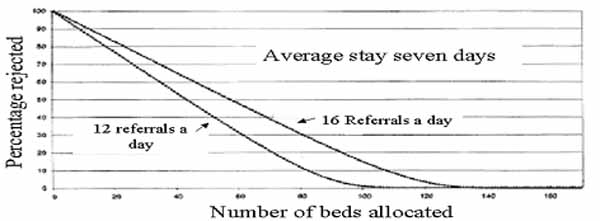
Figure 1. A simple queuing model showing the critical relationship between referral and rejection with a constrained bed allocation.
Queues in Healthcare Systems; Roy Johnston
The author RJ is not happy with the abstract given in the print version; he has felt the need to go into more depth in his outline of the early work.
John Preater's 2001 'Bibliography of queues in medicine and health' can be found on the internet at
http://www.chcm.ubc.ca/comm682/QueueingBib.pdf
See also GORUNESCU, F et al (2002). A queueing model for bed-occupancy management and planning of hospitals. JORS 53, 19-24.
http://www.ingentaconnect.com/content/pal/01605682/2002/00000053/00000001/2601244
We also have pleasure in supporting the Mashnet MASHNET newsletter:
Choice of Models for the Analysis and Forecasting of Hospital Beds.
MACKAY, M. & LEE, M. (2005). Health Care Management Science 8, 221-230.The practical use of the Harrison two and three compartment hospital bed flow models is discussed. Using training and test data the goodness-of-fit achieved by optimisation was measured. Increasing model complexity resulted in over-fitting, and better prediction was achieved with a relatively simple model. In terms of generalisation, the seasonal models performed best. The performance of single day census models was similar, but inferior to that of the models generated from a full year of training data. The additional data make the models better able to capture the variation across the year in activity.
Data: Australian Hospital
See also: HARRISON, G. W. (2001). Implications of mixed exponential occupancy distributions and patient flow models for health care planning. Health Care Management Science 4, 37-45.
Queuing theory accurately models the need for critical care resources
MCManus, ML., LONG, M C.,et al (2004).. Anesthesiology 100, 1271-1276.Modelling two years activity in a busy intensive care unit in Boston, the authors found that turn-away rates increase exponentially when utiliization exceeded 80-85%. Small changes in staff numbers or longer stay patients caused rapid degradation of the system perfomance. They conclude that queing theory provided an accurate means of determining the appropriate supply of beds.
How much does health care cost?
For most patients, the costs attributable to the last day of stay are an economically insignificant amount of costs. Physicians and administrators should focus change on altering care delivery during the early stages of admission. Last day cost just 420 dollars, 2.4% of the total. Approximately 40% of variable costs are spent in the first three days [1]. To reduce overall costs better understanding of cost-drivers and systems is needed; 35% of the costs of care are influenced by physicians [2].
1. Taheri, P. A., et al. (2000). "Length of stay has minimal impact on the cost of hospital admission." Journal of the American College of Surgeons 191(2): 123-30.
2. Taheri, P. A., et al (2000). "Physician impact on the total cost of care." Annals of surgery 231(3): 432-5.
Modelling the feedback effects of reconfiguring health services
Models the shift in cardiac catheterization services. Bringing services 'closer to home' is an established trend. Sounds good, but there may be unintended consequences, including extra referrals. Models clarify the roles for stricter clinical guidelines and capacity increases, and demonstrate the potential benefits of changing goals that drive activity.Taylor, K. & Dangerfield, B. (2005). Journal of the Operational Research Society 56, 659-675.
Factors investigating discharge destination of older hospital patients
Using univariate analysis, this cross European study involving 1,626 patients eight centres in six European countries, found that age, gender, living alone, physical function, cognition, the main body system effected (ICD classification) and the geriatric giants (falling, mobility, continence or cognition) were all statistically related to discharge destination.The authors concluded that case-mix systems to compare risk-adjusted hospital outcome in older medical patients need to incorporate information about physical function, cognition and presenting problems in addition to diagnosis.Campbell, S. E., Seymour, D. G.,et. al (2005). Age and Ageing 34, 467-475.
Intermediate care can be safe and reduce hospital use, but is it and does it?
Randomised controlled trials show what is possible. However, we need also to establish the conditions necessary for success. Descriptive research methods such as systems analyses and case studies should be undertaken alongside controlled studies. Once these conditions for success have been established, we need a systematic quality assurance exercise to ensure that they are being met.Gladman, JR BMJ, 2005;331: 1271 commenting on Crotty M., et al Transitional care facility for elderly people in hospital awaiting a long-term care bed: randomised controlled trial. BMJ 2005;331: 1110-3.
See also
A whole system study of intermediate care services for older people.
A city wide clinical trial in Nottingham, involving 1648 older people in control and interventions groups allocated to hospital or intermediate care services found that both had similar clinical outcomes, but intermediate care did not achieve its strategic objectives of reducing long-term care and hospital use.Young, J.B., et al. Age and Ageing 2005 34, 577-583.
Effects of locality based community hospital care on independence in older people needing rehabilitation: randomised controlled trial
Green, J., Young J., et al.. BMJ 2005 331, 317-320.220 patients needing rehabilitation after an acute illnesst requiring hospital admission. Median length of stay both groups 15 days. \t six months the locality based community hospital was associated with greater independence for older people than care in wards for elderly people in a district general hospital.
Speakers talks from the Quantitative and Predictive Methods in Health Care Management:
Resolving the Queueing Quandary workshop organised by the Clinical Epidemiology & Health Service Evaluation Unit, Melbourne Health and the Department of Mathematics and Statistics, University of Melbourne in December 2005 are now available at the Melbourne Health web site link given below:
http://www.mh.org.au/Royal_Melbourne_Hospital/DEPARTMENTS/A-C
/Clinical_Epidemiology_and_Health_Service_Evaluation_Unit/ARC_Linkages_Project/Workshops/
We don't give this 'hot' because it overflows the line and this can cause problems; it should work if you copy it. Ed.
Forthcoming conferences
EURO XXI 21st European Conference on Operational Research, Reykjavik, Iceland July 2-5, 2006 OR in Health Care Sally Brailsford S.C.Brailsford@soton.ac.uk & Jan Vissers vissers@bmg.eur.nlOR 48 The 48th Annual Conference of Operational Research Society, Bath, UK, 11-13 September 2006; deadline for papers 15th February 2006.
RSS 2006 International conference of the Royal Statistical Society. Queen's University Belfast, 10-14th December 2006. Deadline for submission dates 31st March 2006. contact p.gentry@rss.org.ukn
Congratulations to Barry Shaw PhD, Queen's University Belfast

Barry's thesis, An Extended Bayesian Network Approach to Model the Health Care Costs of Patient Spells in Hospital, supervised by Adele Marshall, introduces a new mathematical approach for modelling the bed costs of geriatric inpatients.
By integrating a cost function within the 'conditional phase-type model', which may be used to model the influence of patient characteristics (e.g. age, gender, reason of admission) on their length of stay in hospital, Barry's model allows the expected costs to be estimated for a group of patients' accumulated time in care.
By altering the parameters of the model, policy changes, such as discharging patients from earlier stages of care or changing the number of beds in the ward, are investigated as potential benefits of such a model to hospital managers.
Some navigational notes:
A highlighted number may bring up a footnote or a reference. A highlighted word hotlinks to another document (chapter, appendix, table of contents, whatever). In general, if you click on the 'Back' button it will bring to to the point of departure in the document from which you came.Copyright (c)Roy Johnston, Ray Millard, 2005, for e-version; content is author's copyright,