Nosokinetics
Understanding Diminishing Returns in the Reduction of Waiting Times
Professor Michael Pidd,
Department of Management Science, Lancaster University, Lancaster LA1 4YX
(comments to
rjtechne@iol.ie,m.pidd@lancaster.ac.uk)
Abstract
The reduction of waiting times is an extremely important element of current health service policy in the UK, and NHS Trusts in England have been generally successful in meeting tighter targets for waiting times. Queuing theory has been widely applied in understanding detailed aspects of health care provision but, used appropriately, simple queuing theory models can shed light on policy issues. In particular, simple queuing models clearly demonstrate that the laws of diminishing returns apply to systems in which service capacity is close to the demand for that capacity. Hence, reductions in long waiting times may be fairly easy to achieve but further reductions get harder and harder. It is important that policymakers and managers appreciate this when using waiting targets as policy levers.
Introduction: waiting time targets
The pressure placed on NHS Trusts to reduce waiting times for both outpatient and inpatient care has been a major plank of the government's health service policy. This has been achieved, as is well-known, by setting targets to be met by English Trusts if they are to be awarded good star ratings. In 2001, Trusts had to ensure that patients waited no longer than 65 weeks (15 months) from the time that they were referred for treatment by a GP to the time of their first outpatient appointment. Since then, the targets have gradually become more severe as shown in Table 1. By December 2008, NHS Trusts are required to ensure that waiting times are no longer than 18 weeks to the time of inpatient admission. This 2008 target is equivalent, in many cases, to 13-weeks if expressed in terms of the earlier targets. In the rest of this paper, the 2008 target is referred to as the 18/13 week target. Over a six or seven year period, Trusts are being required to reduce maximum waiting times to 20% of what they were at the start of the period.
				2001/02  Mar 03  Mar 04   Dec 05   Dec 08
Waiting-time Target (weeks)      65       52      39        26     18/13
To shed some light on this issue, this paper uses an extremely simple queuing theory model to point out the processing improvements that are needed if Trusts are to meet this new target. It is important to realise that the queuing theory is not being used to give precise numerical estimates, but rather to indicate the order of changes that might be needed to meet these targets. It is intended as a contribution to debate on this subject rather than being a definitive answer.
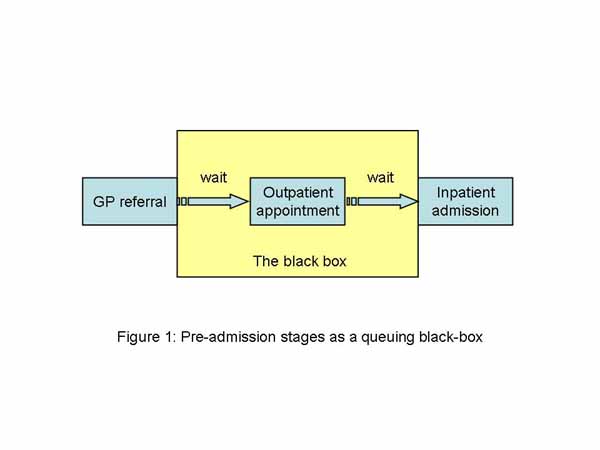
The basic model
Suppose that we consider the preadmission stages of a hospital inpatient admission to be a simple integrated system that we can represent as a black box as shown in Figure 1. Clearly this is far too simple to be representative except in a very crude way, nevertheless it can produce some useful insights. Queuing theory enables us to estimate aspects of the performance of a queuing system based on the relationships between the rate at which customers arrive and the rate at which they are served. Queuing theory has been widely used to understand the operational behaviour of detailed aspects of health care provision [2] and for detailed modelling of waiting lists and their impacts[3], [4], [5] but here is it used to reflect on current macro policy.
The simplest possible queuing system has a deterministic rate of arrival and a deterministic service time: that is, the system literally runs like clockwork. In such systems it is very easy to work out how long a customer will have to wait. Slightly more complicated, but still very simple, is a system in which customers arrive at random and are served at random. Such a system can be modelled as a so-called M/M/1 queue, which has theoretical properties that are well understood. In such queues the most important property is the ratio of the arrival rate to the service rate, which is known as the traffic intensity. Clearly, if the traffic intensity is greater than one then people are arriving at a faster rate than they can be served, which will result in ever longer queues and waiting times. The lower the traffic intensity, the less time customers are expected to spend in the queue.
Using simple queuing theory for an M/M/1 queue, we can construct Figure 2, which shows the expected time that a customer will wait in the queue given different traffic intensities. Since the actual waiting time will depend on the actual value of the service and arrival rates, the waiting time has been standardised relative to an arrival rate of one per unit time. This gives us the standardised waiting time shown in Figure 2. The important feature of Figure 2 is the shape of its curve, which shows an exponential decline in the waiting time relative to a linear increase in the processing rate. Hence, when the service rate is close to the arrival rate but starts to fall, there is a very rapid decrease in the expected waiting time relative to a small increase in the service rate. As we move to the right of the curve it gets much flatter, which implies that the relative improvement in waiting times is much less once the traffic intensity is at a lower value.
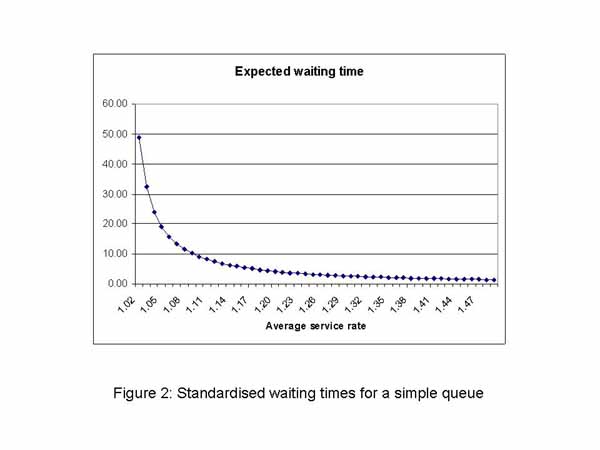
There are only two ways in which the traffic intensity can be decreased: either by reducing the rate at which customers arrive or by increasing the rate at which they are processed. If the arrival rate of customers is not within the control of those operating the queuing system, then their only option is to increase the rate at which customers are served - if they wish to reduce the average waiting time. The simple queuing model makes it clear that there are diminishing returns on subsequent investments required to increase the processing rate; that is, investments in increased capacity.
Increasingly severe waiting time targets
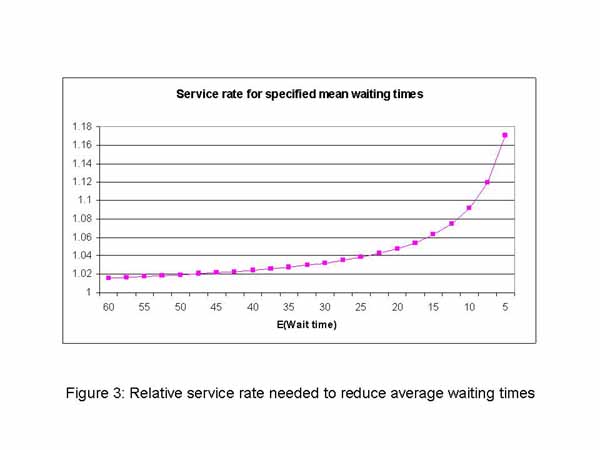
The waiting time targets in table 1 decrease by 13 weeks on each occasion. This is a linear decrease in waiting times, which is something of a contrast with the shape of the curve shown in figure 2, which has an exponential decline as a result of a linear decrease in the traffic intensity.Using queuing theory based on this simple queuing model we can also calculate the service rate that would be needed to produce a particular waiting time, given a specified arrival rate. If for simplicity, we standardise the arrival rate as 1 per time unit, Figure 3 shows the service rates that will be needed to achieve specified average waiting times. The graph shows that reducing the average waiting time from 65 to 25 time units requires a relatively small increase in the service rate. However, further reductions in the average waiting time hit the much steeper part of the curve. So, it is much harder to reduce the average waiting times further, once they have already reached the value of 25 time units.
Discussion
The queuing analysis presented here is far too simple to be translated directly into an analysis of waiting times for inpatient treatment in NHS Trusts. However, it does demonstrate very clearly the law of diminishing returns which applies to all queuing systems: it takes a lot of effort to squeeze the last drops of water from a towel. It is obviously true that different specialties will adopt different approaches to meeting the waiting time targets, however, the same law of diminishing returns applies once a Trust sets about reducing average waiting times.The simple queuing model shows that relatively small increases in service rates can lead to significant reductions in average waiting times, if a Trust’s current performance sits on the flat part of the curve. If the Trust is performing on the steeper part of the curve, then further reductions in average waiting times may be very hard to achieve without further significant investment, or without diverting resources from activities not covered by the targets. It is impossible to use this model to get sensible numerical estimates for any particular Trust since we do not know where the Trust sits on the curve of figure 3. Nevertheless, when setting policy, it is important to understand that the law of diminishing returns will apply. If demand rates are increasing, then resource demands may be even more severe than those implied by the exponential curves shown here.
It is also important to realise that the model presented here uses average waiting times, but the targets refer to maximum waiting times. In statistical terms, the targets relate to the upper tail of the distribution of waiting times, rather than to its mean. Much of the success achieved by Trusts in meeting the targets to date may be because they have removed the longer waits; that is, they have worked on the upper tails of the waiting time distribution. This will reduce the variance of the waiting times but may have a much smaller effect on the mean waiting time. Figure 3 shows the increase in service rates needed to bring about reductions in the mean waiting times. If Trusts have concentrated on the tail of the distribution there still may be some scope for further concentration on the longer waits, however it may now be necessary for them to focus on reducing average waiting time. How easy this will be, depends on where they can be placed on the curve of figure 3.
Finally, waiting lists act as a form of buffer between the demand for services and their provision. In many specialties, demand is seasonal; higher at some periods of the year than others. This allows service managers to provide capacity to meet average demand, knowing that waiting lists will increase at times of high demand but will reduce at times of low demand. Were a service required to have a very short waiting list, it would need to have enough capacity at times of high demand, which means that there will either be spare capacity at times of low demand, or capacity will have to be provided on a seasonal basis. In a cash-limited service, providing spare capacity everywhere seems extremely unwise and it is unclear where extra seasonal capacity could be found. Hence, it is be sensible to keep waiting lists just long enough to cover this seasonal variation.
Acknowledgements
I am grateful for comments and suggestions received from Prof Gwyn Bevan & Dr Alec Morton (LSE), Prof Peter C. Smith (University of York) and Dr David Worthington & Murat Gunal (Lancaster University).
References
1. Lewis R, Appleby J. Can the English NHS meet the 18-week waiting list target?. J R Soc Med. 2006 Jan;99(1):10-3.2. Preater J. A bibliography of queues in health and medicine:
http://www.chcm.ubc.ca/comm682/QueueingBib.pdf
3. Worthington DJ. Hospital waiting list management models. J Operational Res Soc 1991; 42: 833-843.
4. Worthington D.J. Queueing models for hospital waiting lists. J Operational Res Soc 1987; 38: 413-422.
5. Bevan R.G. Taking equity seriously: A dilemma for government from allocating resources to primary care groups. BMJ 1998; 316:39-42 (3 January).
Some navigational notes:
A highlighted number may bring up a footnote or a reference. A highlighted word hotlinks to another document (chapter, appendix, table of contents, whatever). In general, if you click on the 'Back' button it will bring to to the point of departure in the document from which you came.Copyright (c)Roy Johnston, Ray Millard, 2005, for e-version; content is author's copyright,