Nosokinetics
APPLICABILITY OF THE OM TRIANGLE TO HEALTH CARE
Professor Glen Schmidt, David Eccles School of Business,
University of Utah, Salt Lake City
(comments to
rjtechne@iol.ie,glen.schmidt@business.utah.edu)
Abstract
If you are a pilot, you know about the Bermuda triangle. If you study relationships, you have heard of a love triangle. If you enjoy recreational mathematics, you are probably intrigued by Pascal's triangle. But if you read Nosokinetics News, the triangle you should definitely know about is the OM triangle!OPERATIONS MANAGEMENT
Before describing the OM triangle, let me briefly describe what Operations Management (OM) is and how it relates to the field of health care. OM is a field within business and engineering that addresses the flow of materials through production processes. OM has strong roots in manufacturing, but services, such as the treatment of patients, are also effectively production processes.The manufacturing plant takes raw materials (RM) and performs certain process steps to transform these raw materials into finished goods (FG). While being processed, the unfinished products are called work-in-process, or WIP. The firm's inventory is comprised of these three components, the RM, WIP, and FG. Analogously, the patients waiting for treatment in a medical facility effectively represent RM, patients being "worked on" represent WIP, and discharged patients are FG. The medical facility has inventory (of patients) just as the factory has inventory (of products) – the only real difference is that in a medical facility you can't store FG to sell to new arriving customers (wouldn't it be great if you could store a "cured patient" on the shelf and hold it as an immediate cure for a new arriving patient!).
Both the manufacturing plant and the medical facility need to determine the type and number of resources needed in order to transform the RM into FG. For the factory, the resources might consist of presses or machining centers, along with workers. For the medical facility, the resources might be beds, MRI machines, and of course doctors and nurses. The more resources the manufacturer acquires, the more capacity it has. For example, a Toyota plant may have the capacity to produce 500 cars per day. Similarly, the more resources the medical facility has, the more patients it can treat. Analogously, it may have the capacity to treat 500 patients per day.
Factories and medical facilities are also similar in that they must deal with what I call "the curse of variability." There are two keys types of variability; namely, variability in the arrivals of customers (e.g., the arrival of patients to the hospital), and the variability in processes (e.g., it may take longer to diagnose one patient as compared to another). Both of these types of variability wreak havoc in a production process. How can you keep your doctors and nurses busy, but not overworked, if you don't know how many patients will arrive that day, or don't know how long a patient will take to be diagnosed? What each firm would like is information as to the extent of this variability and how to reduce it.
THE OM TRIANGLE: INVENTORY, CAPACITY AND INFORMATION
Thus a medical facility is similar to a factory in many respects, and the notions of "inventory," "capacity" and "variability (or information)" can be analogously defined in both settings. Furthermore, we find that much of the theory that developed from the study of manufacturing can also be applied to services such as health care. Just one example of this is the way some hospitals are implementing the Toyota Production System (Connolly 2005).Another similarity between manufacturing and services is that they both experience tradeoffs depicted in the "OM triangle" (Lovejoy 1998, Schmidt 2005). See Figure 1. The OM triangle depicts the tradeoff between the three factors described above, namely, inventory, capacity, and information. The theory behind the OM triangle is rigorously grounded in queueing theory – see Schmidt (2005) for a somewhat more formal development.
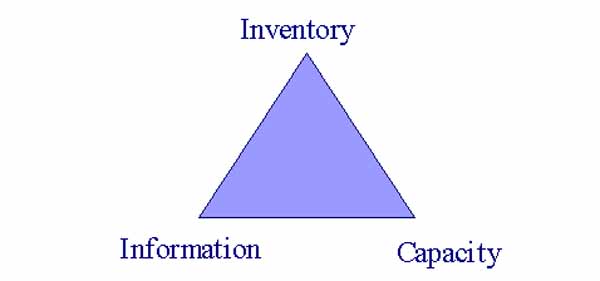
Figure 1. The OM Triangle Portrays the Substitutability of Inventory, Capacity, & Information.
BUYING AN MRI MACHINE: THREE OPTIONS, WHICH CHOICE?
To illustrate the tradeoff, consider the following example. Say you are in charge of running a small hospital. You are currently looking at buying the hospital its first and only MRI machine. Assume you know that on average a patient will arrive every hour or so, but not necessarily with perfect regularity. A less expensive MRI machine can examine a patient in 50 minutes on average, while a more expensive one only takes 30 minutes (but again, there is some variability in the processing times, as not all patients need the same scans). You can only buy only one – which one should it be?Here you are making a decision on how much capacity to acquire. The expensive machine has the capacity to examine two patients per hour, while the less expensive one can examine one every 50 minutes which is equivalent to a lower processing rate of only 1.2 per hour.
Recall that patients arrive at 1 per hour, on average. Say you buy the higher-capacity machine; the one that can process 2 patients per hour. Even though you will be using the machine only half the time (i.e., its capacity utilization will be 30 min. / 60 min. = 0.5 since it can treat a patient in 30 min. and a new patient arrives every 60 min. on average), a patient will sometimes have to wait – sometimes the next patient will arrive before the current patient is done.
A second option is to buy the lower-capacity machine. You will still have more capacity than the minimum needed (its capacity utilization will be 50 min. / 60 min. = 0.83). However, in this case the patients' average waiting time will increase significantly over the wait time experienced with the faster machine. The average number of patients waiting, i.e., the RM inventory, will also increase significantly. This dramatic increase is due to "the curse of variability" – if the capacity or rate at which patients can be treated is not much greater than the rate at which they arrive, variability in the system drives the inventory "sky-high" (and the more variability there is, the worse this relationship gets). See Figure 2.
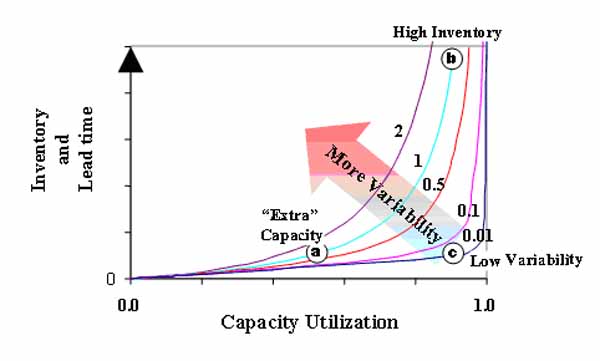
Figure 2: Inventory Skyrockets as Capacity Utilization Approaches One, and as Variability Increases, due to the "Curse of Variability"
A third alternative is to buy the less expensive machine while also spending some money on information. For example, you might invest in an information system that tells you exactly what medical tests every patient in the hospital needs at every point in time. With this information, you might be able to develop a scheduling and tracking system that minimizes each customer's wait, and thereby effectively reduce the variability in arrivals to the MRI machine. In turn, reducing variability in arrivals would reduce the RM inventory (the average number of people waiting).
In the above discussion we described three alternatives on how to "spend your money." To reiterate, option one is to pay the high cost of the fast machine, which minimizes waiting lines and waiting costs. Option two is to reduce machine cost by buying the slow machine, but this will cost you in terms of customer dissatisfaction. Option three is to buy the slow machine but simultaneously buy the information system, thereby again minimizing waiting times and avoiding the cost of dissatisfaction. As this discussion suggests, each option has its costs – it is your job to determine which alternative has the lowest total cost. The option with the lowest total cost would be your best choice (assuming these are the only relevant considerations).
Said another way, capacity and inventory and information are substitutes. If you acquire more capacity you can get by with less information or drive inventory (and customer dissatisfaction) down. If you hold more inventory, you can get by with less capacity or information. If you acquire more information you can get by with less capacity or drive inventory down.
STRATEGIC DECISIONS: MAKING THE RIGHT CHOICE
Different types of health care facilities call for different strategies in managing the tradeoffs depicted by the OM triangle. For example, consider the following three facilities: an emergency room, a hospital that focuses solely on hernia surgeries, and a student infirmary. One of these facilities might best operate at the "capacity" point of the triangle, that is, its money is probably best spent on capacity. Another of these might best operate at the "inventory" point, since the cost it pays by running with higher inventory levels is probably relatively lower. And the strategy of the third of these facilities might best be described as one of acquiring information. Before reading further, can you match up these three facilities with the three points on the OM triangle?The emergency room simply cannot tolerate a high level of inventory (at least not if the customers truly come in because of emergencies – patients will die if they have to wait for service). Furthermore, for practical purposes, the emergency room cannot get advance information regarding customer arrival times and treatment requirements. Thus the emergency room's only real option is to acquire "extra" capacity – some of its resources may go unused for periods of time because these resources must be available just in case of an emergency. (One might argue that the extra capacity that an emergency room acquires isn't really extra – it is optimal to have some capacity that frequently sits idle). The same argument holds for a fire station, for example. When you drive by a fire station, you often see the trucks setting there idle. These idle trucks represent unused capacity – but these extra resources are necessary, because the system simply cannot tolerate an inventory of raw materials (fires waiting to be put out represent RM in this system). The emergency room's position is reflected by point (a) in Figure 2.
The situation for a student infirmary is very different. It typically has a somewhat captive audience, while possibly facing extreme pressures to keep student costs down. Thus while students certainly can become disgruntled by having to wait, such waits may not be all that costly to the infirmary (the students have no acceptable alternatives for their health care – they can't go elsewhere without paying a lot more). Because of the cost pressures, the infirmary may have no money to spend on extra capacity or on sophisticated information systems. Thus such a facility might choose to operate at the "inventory" point on the OM triangle (operating with a high level of inventory, but with relatively lower levels of capacity and information). This is denoted as point (b) in Figure 2.
Finally, consider the hospital that caters to customers who need hernia operations. Shouldice Hospital (Heskett 2003) is such a facility. Shouldice has a very regimented surgical procedure, called the "Shouldice method." Shouldice additionally sends surveys to its patients prior to their arrival asking for information that helps insure that the patients are good candidates for the treatment Shouldice offers (this further helps reduce variability in process time). And Shouldice of course schedules the surgeries, such that variability in the arrivals of customers is virtually nonexistent. Thus Shouldice can operate its facility almost like clockwork, and it can keep nearly all its beds full without creating customer waits (virtually no customer has to wait for a bed). It has information that allows it to virtually eliminate variability – it operates at the "information" point on the OM triangle. This firm effectively operates at point (c) in Figure 2.
Thus the triangle formed by points (a), (b), and (c) in Figure 2 effectively depict the OM triangle. You must decide what is best for your facility – should you operate at the capacity point (a), the inventory point (b), or the information point (c) – or is your best position somewhere in-between? Some questions to ask in determining your best position are: What are the consequences of inventory (long wait times)? Are there ways to mitigate the effect of wait times (e.g., can you entertain the customers while they wait)? Are your resources prohibitively expensive or relatively inexpensive? Are customers willing to pay a premium for immediate service? Is it cost-effective or even possible to get information as to customer arrival times and process times? And importantly, can you find an operating point that differentiates you from your competitors and makes your service a high-value proposition for customers?
CONCLUSION
If you ignore the tradeoffs described by the OM triangle, it will ensnare you more surely than the Bermuda Triangle might ensnarl a pilot. But if you manage these tradeoffs wisely, and in concert with your overarching firm strategy, you will love the manner in which it increase your firm's profitability and performance.
References
Connolly, Ceci (2005). "Toyota Assembly Line Inspires Improvements at Hospital," Washington Post, June 3, 2005.Heskett, James L. (2003), "Shouldice Hospital Limited", Harvard Business Publishing Case 9-683-068
Lovejoy, William (1998), "Integrated Operations: A Proposal for Operations Management Teaching and Research", Production and Operations Management, 7(2).
Schmidt, Glen (2005), "The OM Triangle", Operations Management Education Review, 1(1), 87-104
Glen Schmidt is a Professor at the David Eccles School of Business, University of Utah, Salt Lake City, UT 84103. He can be reached at glen.schmidt@business.utah.edu.
Some navigational notes:
A highlighted number may bring up a footnote or a reference. A highlighted word hotlinks to another document (chapter, appendix, table of contents, whatever). In general, if you click on the 'Back' button it will bring to to the point of departure in the document from which you came.Copyright (c)Roy Johnston, Ray Millard, 2005, for e-version; content is author's copyright,